
From Voice Chat Robot to Energy Speedometer with ESP32 + Home Assistant
Most gadgets end up doing something completely different than what they were made for. The XiaoZhi ESP32 AI Voice Chat Robot is one of them. Out of the box, it’s a toy with speech recognition and a small round LCD screen. But under the hood it’s just an ESP32-S3 with a GC9A01A display. This makes it a perfect little device to hack into something useful.
In this project, we’ll transform it into an Energy Speedometer that shows:
- ⚡ Live power consumption (from your smart meter via Home Assistant)
- 💰 Current electricity price (from Nord Pool)
- 🏷 Hourly cost (kr/h) calculated from consumption × price
- 📈 Rolling graph of your last two minutes of usage
And the best part: all of this integrates seamlessly into Home Assistant using ESPHome.
Hardware You Need
- 📦 Hardware You Need
- XiaoZhi ESP32 AI Voice Chat Robot (ESP32-S3 + GC9A01A round LCD)
- A Home Assistant setup (with AMS reader or other power sensor)
- Nord Pool integration for electricity prices
- WiFi
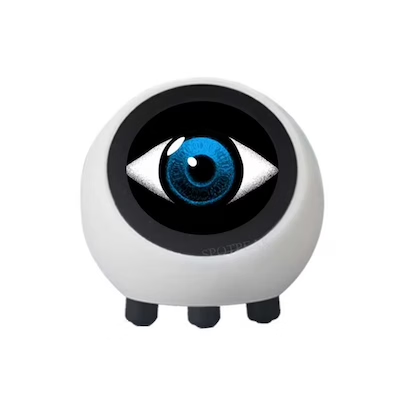
- 👉 This is what the little robot looks like before the hack:
⚙️ Step 1 – Flash ESPHome Firmware
Install the ESPHome add-on in Home Assistant (or use the ESPHome Web flasher).
- Create a new device named
energy-speedometer. - Paste in the configuration (see below).
- Flash it to the device via USB.
Once it boots and connects to WiFi, it will show up automatically in Home Assistant → Integrations.
📜 Step 2 – ESPHome Configuration
Here’s the full config with comments:
esphome:
  name: energy-speedometer
  friendly_name: Energy speedometer

esp32:
  board: esp32-s3-devkitc-1
  framework:
    type: esp-idf

psram:
  mode: octal
  speed: 80MHz

logger:

api:
  encryption:
    # Replace with your own API encryption key
    key: "YOUR_API_ENCRYPTION_KEY_HERE"

ota:
  platform: esphome
  # Replace with your own OTA password
  password: "YOUR_OTA_PASSWORD_HERE"

wifi:
  ssid: !secret wifi_ssid
  password: !secret wifi_password

  ap:
    ssid: "Energy-Speedometer"
    # Replace with your own fallback AP password
    password: "YOUR_FALLBACK_AP_PASSWORD_HERE"

captive_portal:

output:
  - platform: ledc
    pin: GPIO42
    id: backlight_output
    inverted: true

light:
  - platform: monochromatic
    id: screen_backlight
    output: backlight_output
    restore_mode: ALWAYS_ON
    internal: true

# Rolling history for manual graph
globals:
  - id: power_history
    type: std::vector<float>
    restore_value: false
    initial_value: "std::vector<float>()"

sensor:
  # Active import power from Home Assistant
  - platform: homeassistant
    id: ha_power
    entity_id: sensor.ams_ba4a_p
    name: "Active Import Power"
    unit_of_measurement: "W"
    accuracy_decimals: 0
    on_value:
      then:
        - lambda: |-
            // History window ~2 minutes with 1s updates
            const size_t HISTORY_LEN = 120;
            id(power_history).push_back(x);
            if (id(power_history).size() > HISTORY_LEN) {
              id(power_history).erase(id(power_history).begin());
            }
            ESP_LOGD("ha_power", "Received power value: %.1f W", x);

  # Electricity price from Nord Pool (current hour)
  - platform: homeassistant
    id: ha_price
    entity_id: sensor.nordpool_kwh_no3_nok_3_10_025
    name: "Electricity Price"
    unit_of_measurement: "NOK/kWh"
    accuracy_decimals: 3
    on_value:
      then:
        - lambda: |-
            ESP_LOGD("ha_price", "Received price: %.3f NOK/kWh", x);

spi:
  - id: spi_bus
    clk_pin: 4
    mosi_pin: 2

display:
  - platform: ili9xxx
    id: s3_box_lcd
    model: GC9A01A
    spi_id: spi_bus
    cs_pin: 5
    dc_pin: 47
    reset_pin: 38
    data_rate: 20MHz
    invert_colors: true
    dimensions:
      height: 240
      width: 240
    rotation: 0
    auto_clear_enabled: false
    update_interval: 1s
    lambda: |-
      Color green  = Color(0, 255, 0);
      Color yellow = Color(255, 255, 0);
      Color red    = Color(255, 0, 0);
      Color white  = Color(255, 255, 255);
      Color grey   = Color(60, 60, 60);
      Color black  = Color(0, 0, 0);

      it.fill(black);

      float value = isnan(id(ha_power).state) ? 0.0f : id(ha_power).state;
      float price = id(ha_price).has_state() ? id(ha_price).state : NAN;
      float cost  = (!isnan(price)) ? (value / 1000.0f) * price : NAN;  // NOK/h

      const float max_watts = 7000.0f;

      const int cx = 120;
      const int cy = 120;
      const int radius = 100;

      // Needle color based on load
      Color needle_color = green;
      if (value > 4000) needle_color = red;
      else if (value > 2000) needle_color = yellow;

      // Background arc (green -> yellow -> red)
      for (int a = -120; a <= 120; a++) {
        float pct = (a + 120) / 240.0f;
        Color col = green;
        if (pct > 0.66f) col = red;
        else if (pct > 0.33f) col = yellow;
        float rad1 = (a - 1) * M_PI / 180.0f;
        float rad2 = a * M_PI / 180.0f;
        int x1 = cx + (int)((radius - 10) * cosf(rad1));
        int y1 = cy + (int)((radius - 10) * sinf(rad1));
        int x2 = cx + (int)((radius - 2) * cosf(rad2));
        int y2 = cy + (int)((radius - 2) * sinf(rad2));
        it.line(x1, y1, x2, y2, col);
      }

      // Ticks and labels
      for (int w = 0; w <= 7000; w += 1000) {
        float angle = -120.0f + (w / max_watts) * 240.0f;
        float rad = angle * M_PI / 180.0f;
        int x1 = cx + (int)((radius - 15) * cosf(rad));
        int y1 = cy + (int)((radius - 15) * sinf(rad));
        int x2 = cx + (int)(radius * cosf(rad));
        int y2 = cy + (int)(radius * sinf(rad));
        it.line(x1, y1, x2, y2, white);

        if (w % 2000 == 0) {
          int lx = cx + (int)((radius - 35) * cosf(rad));
          int ly = cy + (int)((radius - 35) * sinf(rad));
          it.printf(lx, ly, id(font_small14), white, TextAlign::CENTER, "%d", w);
        }
      }

      // Needle
      float angle = -120.0f + (value / max_watts) * 240.0f;
      angle = std::max(-120.0f, std::min(120.0f, angle));
      float rad = angle * M_PI / 180.0f;
      int nx = cx + (int)((radius - 20) * cosf(rad));
      int ny = cy + (int)((radius - 20) * sinf(rad));
      it.line(cx, cy, nx, ny, needle_color);
      it.filled_circle(cx, cy, 4, white);

      // COST (NOK/h) – top left, color-coded
      // Thresholds: <1.5 green, 1.5–3.0 yellow, >3.0 red
      Color cost_color = white;
      if (!isnan(cost)) {
        cost_color = green;
        if (cost > 3.0f) cost_color = red;
        else if (cost > 1.5f) cost_color = yellow;
      }
      if (!isnan(cost)) {
        it.printf(12, 96, id(font_bold18), cost_color, TextAlign::CENTER_LEFT, "Cost: %.2f NOK/h", cost);
      } else {
        it.printf(12, 96, id(font_bold18), white, TextAlign::CENTER_LEFT, "Cost: --");
      }

      // Live consumption – smaller font (16 px) adjusted up
      it.printf(12, 148, id(font_bold16), white, TextAlign::CENTER_LEFT, "Live: %.0f W", value);

      // Price – smaller font (14 px), below Live
      if (!isnan(price)) {
        it.printf(12, 170, id(font_bold14), white, TextAlign::CENTER_LEFT, "Price: %.2f NOK/kWh", price);
      } else {
        it.printf(12, 170, id(font_bold14), white, TextAlign::CENTER_LEFT, "Price: --");
      }

      // Dynamically scaled history graph at the bottom
      const int g_x = 0;
      const int g_w = 240;
      const int g_h = 24;
      const int g_y_base = 235;      # baseline y

      // Graph color based on latest load
      Color graph_color = green;
      if (value > 4000) graph_color = red;
      else if (value > 2000) graph_color = yellow;

      const auto &buf = id(power_history);
      if (buf.size() >= 2) {
        // Find min/max in window
        float vmin = buf[0];
        float vmax = buf[0];
        for (size_t i = 1; i < buf.size(); i++) {
          vmin = std::min(vmin, buf[i]);
          vmax = std::max(vmax, buf[i]);
        }

        // Padding for visibility
        float range = vmax - vmin;
        float pad = std::max(20.0f, range * 0.10f);  # at least 20 W and ~10%
        vmin = std::max(0.0f, vmin - pad);
        vmax = std::min(max_watts, vmax + pad);
        range = std::max(1.0f, vmax - vmin);

        # Draw line across full width
        const size_t N = buf.size();
        for (size_t i = 1; i < N; i++) {
          float t1 = (buf[i - 1] - vmin) / range; if (t1 < 0.0f) t1 = 0.0f; if (t1 > 1.0f) t1 = 1.0f;
          float t2 = (buf[i]     - vmin) / range; if (t2 < 0.0f) t2 = 0.0f; if (t2 > 1.0f) t2 = 1.0f;
          int y1 = g_y_base - (int)(t1 * g_h + 0.5f);
          int y2 = g_y_base - (int)(t2 * g_h + 0.5f);
          int x1 = g_x + (int)((i - 1) * (g_w - 1) / (float)(N - 1));
          int x2 = g_x + (int)( i      * (g_w - 1) / (float)(N - 1));
          it.line(x1, y1, x2, y2, graph_color);
        }
      }

font:
  # Bold 18 px – for "Cost"
  - file: "gfonts://Roboto@700"
    id: font_bold18
    size: 18

  # Bold 16 px – for "Live"
  - file: "gfonts://Roboto@700"
    id: font_bold16
    size: 16

  # Bold 14 px – for "Price"
  - file: "gfonts://Roboto@700"
    id: font_bold14
    size: 14

  # Small labels on the gauge scale
  - file: "gfonts://Roboto"
    id: font_small14
    size: 14
🖼 Step 3 – How the Display Works
The firmware turns the round display into a dashboard-style gauge.
Here’s the layout:
- Bottom (Graph): last ~2 minutes of consumption history
- Arc (green → yellow → red): shows load range
- Needle: current load (0–7000 W)
- Ticks & labels: every 1000 W, with numbers every 2000 W
- Top left (Cost): current hourly cost in NOK
- Middle left (Live): current consumption in watts
- Below Live (Price): current Nord Pool price in NOK/kWh
🏠 Step 4 – Integrating with Home Assistant
When the ESP32 connects to your network, you’ll see it appear in Home Assistant:
- Go to Settings → Devices & Services
- Find ESPHome: energy-speedometer
- Click Configure → Done!
The ESPHome config pulls these values directly from Home Assistant:
sensor.ams_ba4a_p→ Active Power (from smart meter)sensor.nordpool_kwh_no3_nok_3_10_025→ Electricity Price (from Nord Pool)
🔧 Step 5 – Daily Use
Now your old voice chat robot is reborn as a real-time energy dashboard:
- The needle moves instantly with your load (turn on the oven, watch it spike).
- The hourly cost changes as price and consumption shift.
- The graph at the bottom shows short-term history so you can see spikes.
✅ Hack Complete
A $20 chat toy just became a serious energy monitoring tool.
Instead of dust on a shelf, you now have a live energy gauge that reminds you exactly how much electricity you’re using – and how much it’s costing.
Some of the links in this article are "affiliate links", a link with a special tracking code. This means if you click on an affiliate link and purchase the item, we will receive an affiliate commission. The price of the item is the same whether it is an affiliate link or not. Regardless, we only recommend products or services we believe will add value to our readers. By using the affiliate links, you are helping support our Website, and we genuinely appreciate your support.